WITNESS THE
POWER OF
DATA
MANIPULATION
about
tarr analytics, llc
Tarr Analytics is a Data Analytics organization that can help you use data to increase the success of your business.
David tarr
I am excited about the opportunity to work with your business, because I believe the use of data can make just about any business operate at a higher level, and I enjoy playing a role in that process. I’m currently enrolled in a data analytics course where I will earn the Google Data Analytics Professional Certificate. Through the course I’ll be learning the fundamentals of database languages, such as SQL and R. I’ll also be learning how to clean data in a data set, as well as how to create visualizations of the data for myself and for other people using the data, in order to make it easier to understand what the data is telling us. After this course, I plan to take on Google’s Advanced Data Analytics and Business Intelligence Certificates, as well as an online course in Python, in order to have a more well-rounded education in skills that I can use in Data Analysis.
I have worked in multiple industries and have held management positions in most of those industries. Before working at Amazon, which is where I am currently, I’ve been an office manager for a multi-family construction company, a supervisor for a crime & trauma clean-up service, a lead technician for a water restoration service, a general manager for a restaurant, and a loan officer. All of these positions required me to handle a large workload, be capable of training others to do the job as well, and in most of these fields I’ve been responsible for leading a team, both by example and by delegating tasks to others.
Overall, I believe that my ability to learn new skills, learn and operate within a complex work environment, my ability to problem-solve, as well as my ability to manage resources available to me, make my business a great asset. I would love to see what I can do for your business
our work
We are able to both help you implement technologies within your organization to track metrics you find important, as well as help you make sense of what the data shows, in order to reduce inefficiencies and increase the customer impact of your products.


David Tarr
Owner / Data analyst
Background
I believe in the small business owner, and I know that’s it’s tough to manage a new business, as well as make a name for yourself. I aim to help small businesses grow over time.
Solution
Finding inefficiencies and waste within an organization helps to streamline processes, as well as reduce wasted revenue that can sink a new small business. Finding the inefficiencies, and then fixing them, is a huge part of helping your small business scale and move to the next level.

Background
SQL
SQL Project - Coming Soon
Solution

case study
I was asked to analyze a bikeshare company out of Chicago named Cyclistic. This company wanted to look into how they might be able to convert more casual bike rider to annual membership customers.
cYCLISTIC
Solution
Based on the data I analyzed, I recommended that Cyclistic create a new promotion that offers riders benefits for a discounted price, but only for weekend. This is because the data showed that most casual riders without an annual membership ride on the weekends.
capstone project

Background
sPREADSHEETS
Solution
excel project - coming soon

demo video
pROBLEM
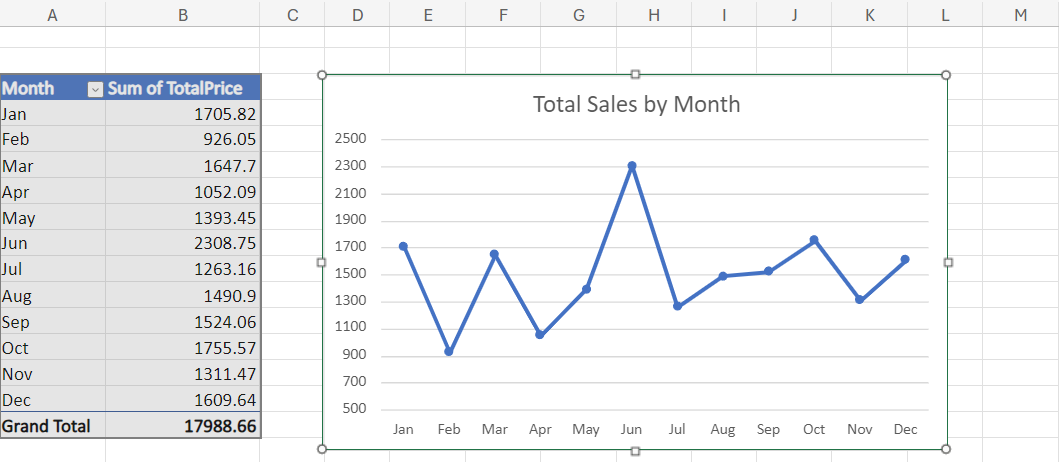
I am working with a collection of sales data, but the amount of data I am working with is difficult to get answers from, being as large as it is. In this situation it would be nice to break out the specific information I’m looking for in a different way to get answers.
Solution
In this Demo Video I show how the use of Tables, Pivot Tables, and Charts can be very helpful in interpreting data.